Exposing Metrics with Expvar
Viewing metrics for our application is made easy by the fact that the expvar package provides an expvar.Handler() function which returns a HTTP handler exposing your application metrics.
By default this handler displays information about memory usage, along with a reminder of what command-line flags you used when starting the application, all outputted in JSON format.
So the first thing that we’re going to do is mount this handler at a new GET /debug/vars endpoint, like so:
| Method | URL Pattern | Handler | Action |
|---|---|---|---|
| … | … | … | … |
| GET | /debug/vars | expvar.Handler() | Display application metrics |
package main

import (
    "expvar" // New import
    "net/http"

    "github.com/julienschmidt/httprouter"
)

func (app *application) routes() http.Handler {
    router := httprouter.New()

    router.NotFound = http.HandlerFunc(app.notFoundResponse)
    router.MethodNotAllowed = http.HandlerFunc(app.methodNotAllowedResponse)

    router.HandlerFunc(http.MethodGet, "/v1/healthcheck", app.healthcheckHandler)

    router.HandlerFunc(http.MethodGet, "/v1/movies", app.requirePermission("movies:read", app.listMoviesHandler))
    router.HandlerFunc(http.MethodPost, "/v1/movies", app.requirePermission("movies:write", app.createMovieHandler))
    router.HandlerFunc(http.MethodGet, "/v1/movies/:id", app.requirePermission("movies:read", app.showMovieHandler))
    router.HandlerFunc(http.MethodPatch, "/v1/movies/:id", app.requirePermission("movies:write", app.updateMovieHandler))
    router.HandlerFunc(http.MethodDelete, "/v1/movies/:id", app.requirePermission("movies:write", app.deleteMovieHandler))

    router.HandlerFunc(http.MethodPost, "/v1/users", app.registerUserHandler)
    router.HandlerFunc(http.MethodPut, "/v1/users/activated", app.activateUserHandler)

    router.HandlerFunc(http.MethodPost, "/v1/tokens/authentication", app.createAuthenticationTokenHandler)

    // Register a new GET /debug/vars endpoint pointing to the expvar handler.
    router.Handler(http.MethodGet, "/debug/vars", expvar.Handler())

    return app.recoverPanic(app.enableCORS(app.rateLimit(app.authenticate(router))))
}
OK, let’s try this out.
Go ahead and restart the API, passing in a couple of command line flags for demonstration purposes. Like so:
$ go run ./cmd/api -limiter-enabled=false -port=4000
time=2023-09-10T10:59:13.722+02:00 level=INFO msg="database connection pool established"
time=2023-09-10T10:59:13.722+02:00 level=INFO msg="starting server" addr=:4000 env=development
And if you visit http://localhost:4000/debug/vars in your web browser, you should see a JSON response containing information about your running application.
In my case, the response looks like this:
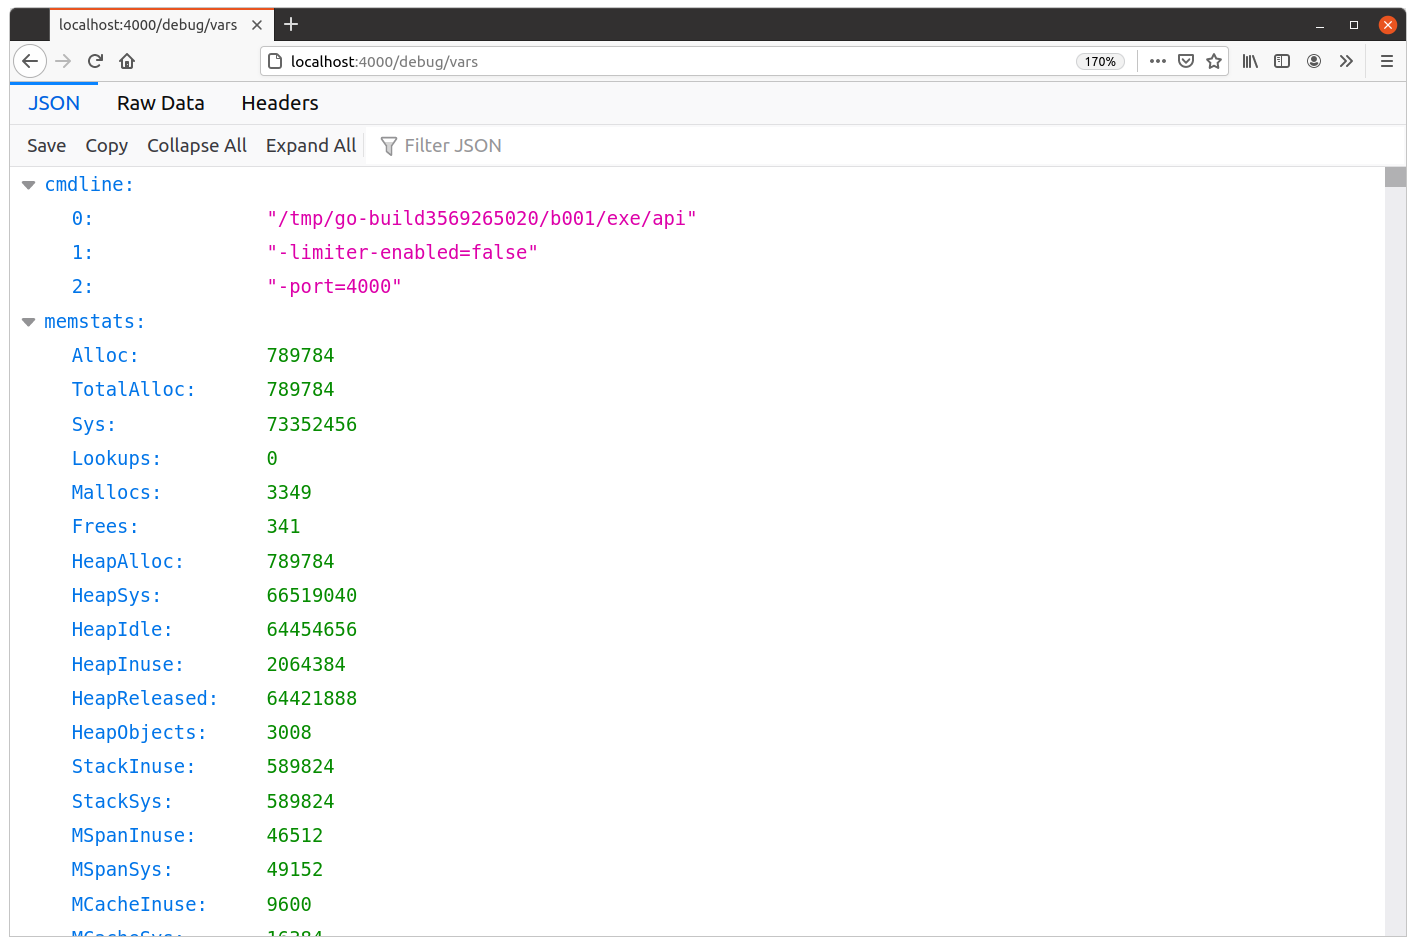
We can see that the JSON here currently contains two top-level items: "cmdline" and "memstats". Let’s quickly talk through what these represent.
The "cmdline" item contains an array of the command-line arguments used to run the application, beginning with the program name. This is essentially a JSON representation of the os.Args variable, and it’s useful if you want to see exactly what non-default settings were used when starting the application.
The "memstats" item contains a ‘moment-in-time’ snapshot of memory usage, as returned by the runtime.MemStats() function. Documentation and descriptions for all of the values can be found here, but the most important ones are:
TotalAlloc— Cumulative bytes allocated on the heap (will not decrease).HeapAlloc— Current number of bytes on the heap.HeapObjects— Current number of objects on the heap.Sys— Total bytes of memory obtained from the OS (i.e. total memory reserved by the Go runtime for the heap, stacks, and other internal data structures).NumGC— Number of completed garbage collector cycles.NextGC— The target heap size of the next garbage collector cycle (Go aims to keepHeapAlloc≤NextGC).